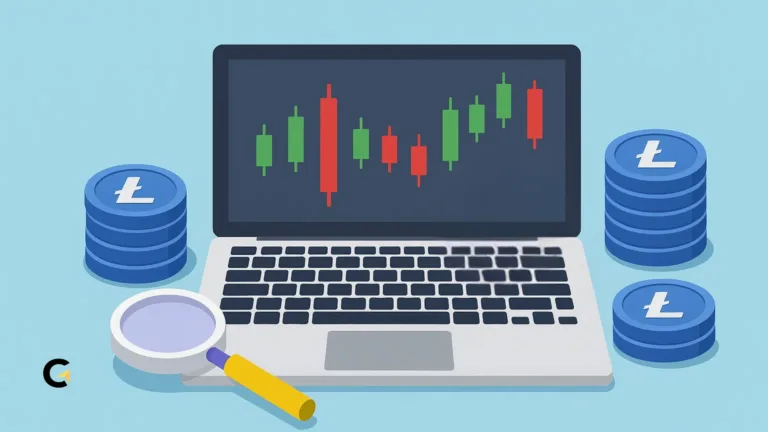
Don’t Fall for the FOMO: 9 Bitcoin Correction Signals You Need to Know
Early 2025 has been one big crypto party—especially for Bitcoin. Institutional money is flowing in fast through spot ETFs, and BTC has been flying to all-time highs.
Everywhere you look, there’s hype and hope. It feels like people think Bitcoin is going straight to the moon with no pit stops.
But let’s be real—if you’ve been in the game for a while, you know how this goes. Every parabolic run eventually cools off. That’s not being negative—it’s just how markets work.
So if you want to stay ahead and protect your capital like a pro, you need to watch for the warning signs.
Quick Facts You Need to Know
Hide-
RSI Over 70: Market’s getting too hyped.
-
Bollinger Bands Widening: Big moves ahead—could go either way.
-
Weak Volume: Price up, energy down = sus.
-
Spike in Open Interest: Watch for mass profit-taking.
-
ETF Flows Turn Negative: Big players might be stepping back.
-
Pi Cycle Top Crossover: A classic market-top signal.
-
Puell Multiple High: Miners might start cashing out.
-
MVRV-Z Score Extreme: BTC might be overvalued.
-
Realized Profits 7DMA Dropping: Short-term holders are exiting.
These nine signals aren’t magic—they’re battle-tested technical and on-chain indicators that often flash before a major pullback hits.
1. RSI Over 70: Market Might Be Overheating
The RSI (Relative Strength Index) is like the mood ring of the market—it shows whether things are too hot or too cold.
Once it climbs above 70, that’s usually a sign everyone’s buying like there’s no tomorrow. And when too many people jump in at once, a cooldown often follows.
Does this mean prices will crash instantly? Not necessarily. But it is a wake-up call that the party might be winding down.
FYI: In previous bull runs, RSI over 70 often showed up right before BTC dropped 20–30% within a few weeks.
2. Bollinger Bands Go Wide: Volatility Loading…
Bollinger Bands basically measure how “wide” or “tight” price action is. When they’ve been narrow for a while and suddenly stretch out, it means something big is coming. Could be up, could be down—but the market’s gearing up for a move.
And if the price is hugging the upper band while volume stays weak? That’s a red flag. A reversal might be just around the corner.
Pro tip: High RSI + upper Bollinger touch + low volume = triple trouble.
3. Volume Doesn’t Match Price: The Rally Might Be Running on Fumes
Volume is the fuel behind price movement. If prices are rising but volume’s not keeping up, it could mean the move is being driven by FOMO rather than real buyer conviction.
This often happens near the top—retail piles in late, while smart money quietly exits. It’s like dancing on a volcano.
Back in April 2021, BTC kept climbing even as volume dropped off. A week later? Boom—35% correction.
4. Open Interest Spikes: More Leverage, More Risk
Open interest tracks the number of active derivatives contracts like futures. When this suddenly shoots up, it means lots of traders are opening positions—longs, shorts, you name it. But more leverage = more liquidations when things get spicy.
A small price dip can trigger forced selling, causing a chain reaction. And yeah, it usually doesn’t end well for latecomers.
Massive OI spikes often come right before sharp short-term dips, especially on platforms like Binance.
5. Exchange Flows Flip: From Buying to Withdrawing
When ETF and exchange inflows slow down—or worse, turn into outflows—that’s your cue that whales might be shifting gears. If they’re pulling funds, it’s often because they’re hedging or cashing out.
Institutions don’t panic sell, but when they see risk rising, they rotate. And when inflows die down, so does momentum.
Watching flows into products like GBTC can give you early signals of selling pressure building.
6. Pi Cycle Top: A Nerdy but Scary Accurate Indicator
This one’s a fan favorite for a reason. The Pi Cycle Top uses two moving averages—111-day and a 2x of the 350-day MA. When they cross, it’s often marked the peak of previous bull markets to the day.
It’s not magic, just math. But when paired with other indicators, it can be a powerful warning sign.
7. Puell Multiple: Miners Are Eating Good… But Might Start Selling
The Puell Multiple tracks how much miners are earning compared to their 365-day average. When the number is high, they’re making bank—and that’s often when they start selling to lock in profits.
And post-halving, with rewards slashed, miners get even more sensitive about price. So if they’re selling, take note.
Historically, spikes in this metric have preceded 20–40% corrections within weeks.
8. MVRV-Z Score Gets Spicy: BTC Might Be Overvalued
The MVRV-Z Score compares Bitcoin’s current market cap to its “realized value” (aka the average price at which coins last moved). When the score rises above 2, that often signals overvaluation.
Long-term holders see that and start taking profits. The result? Downward pressure.
In both 2017 and 2021, MVRV-Z hit above 3.5—right before Bitcoin crashed hard.
9. Realized Profits 7DMA Drops: Short-Term Holders Are Jumping Ship
This indicator tracks the 7-day moving average of profits being realized. When it starts dropping fast, it means people are cashing out.
It’s often the short-term holders who panic first, and when they start selling, things can unravel quickly.
Just before the May 2021 crash, this signal dipped sharply—classic early warning of a selloff.
Final Thoughts: Don’t Rely on Just One Signal
No single indicator will ever give you the full picture. But when several of these start flashing red at once? That’s your cue to tighten stops, take some profits, or hedge your bets.
Crypto moves fast, but you don’t have to get caught in the chaos. Be alert, not alarmed. And remember:
Smart investing isn’t about riding every pump—it’s about surviving every dump.
Frequently Asked Questions (FAQs)
Is RSI reliable on its own?
RSI is great for spotting overbought vibes, but it can stay high during strong trends. Pair it with volume and Bollinger Bands for a clearer picture.
How do I check the Pi Cycle Top?
Use TradingView or similar charting platforms. Add the 111-day MA and a 350-day MA multiplied by 2. Watch for a crossover—it’s been eerily accurate in the past.
What’s the difference between MVRV Ratio and MVRV-Z Score?
The MVRV Ratio compares market value to realized value. The Z Score adds standard deviation to help you identify statistically extreme valuations.
Which indicators give the fastest warnings?
Volume divergence and open interest spikes usually hit early. On-chain signals like MVRV-Z or Puell are better at showing deeper, systemic shifts.
How should I use these together in strategy?
Combine across categories: Technical (like RSI, Bollinger), On-Chain (MVRV-Z, Puell), and Market Data (flows, OI). Don’t act on one—look for confirmation.