How to Use the Crypto Fear and Greed Index?
The Crypto Fear and Greed Index is a tool designed to quantify the emotions and sentiments driving the cryptocurrency market.
This tool helps to underlying mood of market participants, potentially signaling opportune moments for buying or cautionary moments for selling. But how exactly are these indexes meant to be used?
Key Takeaways:
ShowWhat Is the Crypto Fear and Greed Index?
At its core, the Crypto Fear and Greed Index measures investor sentiment in the cryptocurrency market.
It captures whether market participants are exhibiting fear or greed by aggregating a variety of market indicators into one score.
A reading closer to 0 suggests that emotions are dominated by fear, often correlating with market downturns and potential buying opportunities, while a score near 100 indicates rampant greed, which can precede market corrections due to overbought conditions.
The Origin of the Index
The index was introduced in 2018 by Alternative.me, inspired by CNN’s Money Fear and Greed Index from the traditional stock market.
Recognizing that the cryptocurrency market operates under unique dynamics, Alternative.me adapted this concept to address the rapid shifts and emotional volatility typical in crypto trading.
This adaptation acknowledged that while both traditional and crypto markets are influenced by investor sentiment, cryptocurrencies often display amplified responses due to their high volatility and market novelty.
How the Fear and Greed Index Is Calculated
The calculation of the Crypto Fear and Greed Index is based on a blend of several key metrics, each contributing a weighted percentage to the final score. The main components include:
- Volatility (25%): This measures the current volatility of Bitcoin compared to its 30-day and 90-day averages. Increased volatility usually signals heightened fear among investors.
- Market Momentum/Volume (25%): By analyzing current trading volumes and market momentum against historical averages, this metric identifies whether strong buying activity (indicative of greed) is present.
- Social Media (15%): Sentiment analysis from platforms like Twitter and Reddit is performed using natural language processing to gauge the overall tone of crypto-related conversations.
- Bitcoin Dominance (10%): This factor examines Bitcoin’s market share relative to the broader cryptocurrency market. A rising Bitcoin dominance can be seen as a flight to safety, reflecting investor fear.
- Google Trends (10%): By evaluating search queries related to cryptocurrencies, this metric discerns whether increased interest is being driven by bullish or bearish sentiment.
How to Use the Fear and Greed Index

These index combines several metrics. Each component is measured and weighted to produce a final score.
It assigns a score from 0 to 100, with lower scores indicating fear and higher scores indicating greed. But how exactly to read the Crypto Fear and Greed Index?
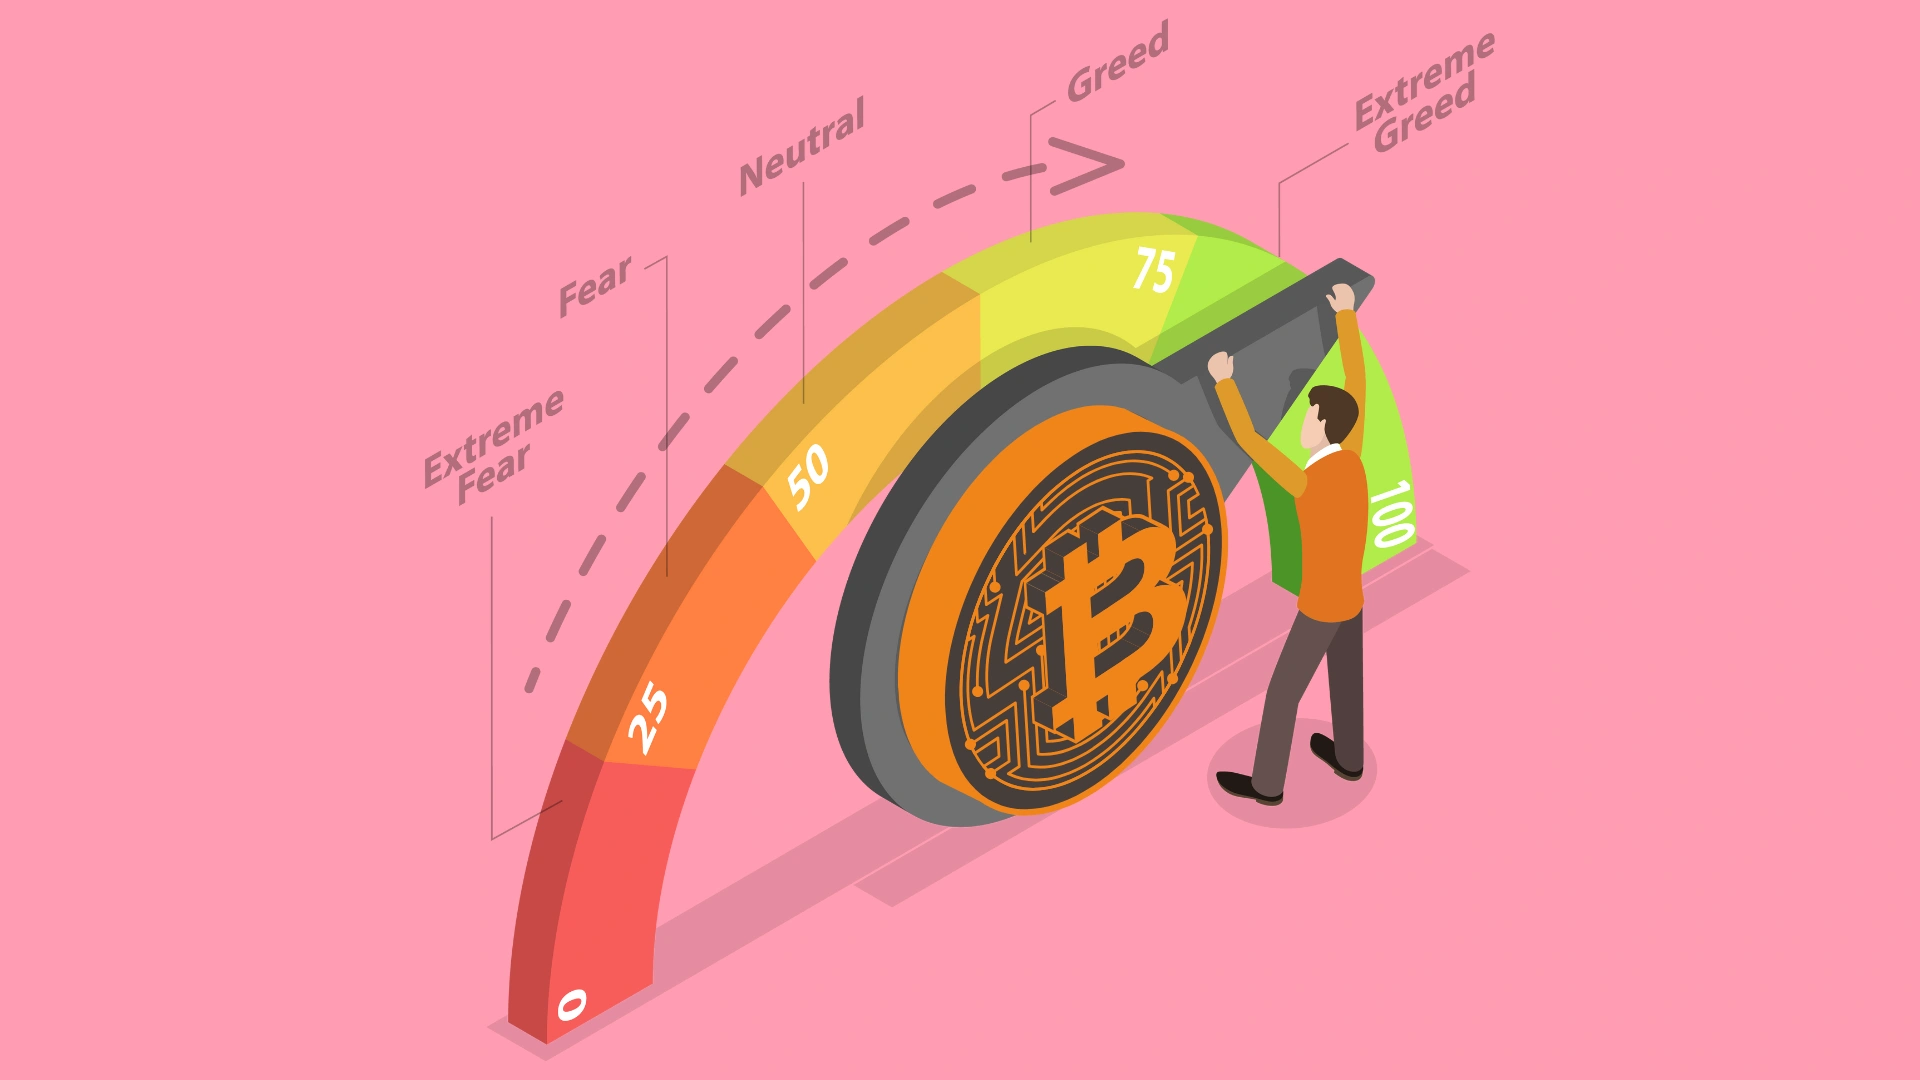
How to Read the Crypto Fear and Greed Index
The index’s score is typically broken down into several sentiment ranges:
- 0-24 (Extreme Fear): This range indicates significant panic in the market. Investors may find that assets are undervalued, suggesting potential buying opportunities.
- 25-44 (Fear): A score within this range implies cautious or pessimistic sentiment. It may be a signal for investors to be conservative with their positions.
- 45-55 (Neutrality): Here, the market sentiment is balanced, with neither strong fear nor greed dominating. This can be an ideal period for taking a wait-and-see approach.
- 56-75 (Greed): This level shows a generally optimistic or bullish market, often leading to rising prices.
- 76-100 (Extreme Greed): Such high scores suggest that the market may be overbought, and there is a risk of a correction as sentiment may be overly optimistic.
Investors use the index in various ways. For instance, contrarian investors might view extreme fear as a signal to buy and extreme greed as a cue to sell.
Additionally, the index can be paired with technical analysis tools, such as moving averages or Relative Strength Index (RSI), to help confirm market trends and set entry or exit points.
It also aids in risk management by indicating when it might be wise to tighten stop-loss orders or secure profits during periods of market exuberance.
Any Specific Risks to Watch Out For
- Oversimplification: The index reduces market complexity to a single number, but crypto is affected by way more than just fear and greed. Regulatory news, technological advancements, and adoption rates all play a big role.
- Lagging Indicator: It primarily reflects past data, so it might not catch sudden market shifts caused by breaking news.
- Bitcoin Bias: The index leans heavily on Bitcoin, so it might not accurately reflect the sentiment of altcoins, which can move independently.
- Market Manipulation: Sentiment can be artificially inflated or deflated through coordinated social media campaigns or whale activity, skewing the index.
Tips to Maximize the Index’s Insights
- Identify Extreme Levels: High greed could mean the market’s overbought and due for a correction8. Extreme fear could mean the opposite.
- Follow a Trading Plan: Develop a system where you increase your crypto exposure when the index drops into deep fear and reduce exposure when it hits extreme greed. Over time, this discipline can improve your results.
- Set realistic profit goals: Taking profits too early out of fear of losing, or holding onto losses for too long hoping the market will reverse, are common pitfalls.
- Don’t Overtrade: The index can fluctuate, and overtrading leads to bigger losses.
Expert Insights
Market experts widely recognize the Crypto Fear and Greed Index as a valuable tool for deciphering market psychology.
Many analysts emphasize that while the index provides a straightforward, data-driven assessment of sentiment, it should not be relied upon in isolation.
Instead, it works best when combined with other analytical tools and indicators.
Professionals in the industry stress the importance of using the index to avoid making purely emotional decisions, advising that it be part of a broader strategy that also incorporates technical and fundamental analysis, on-chain data, and macroeconomic insights.
Historical Context: Case Studies
Examining the index during key historical market events reveals intriguing patterns:
- 2017 Bull Market: During this period, the index climbed from neutral sentiment to extreme greed, paralleling a dramatic price surge in Bitcoin.
- The rapid increase in media attention and positive regulatory news fueled FOMO (fear of missing out), ultimately leading to an almost 2000% increase in Bitcoin’s price. However, this extreme optimism was later followed by a sharp correction.
- 2018 Bear Market: The index predominantly reflected levels of fear and extreme fear throughout the year.
- Negative news and regulatory uncertainties contributed to a prolonged decline in prices, with Bitcoin falling significantly and the index remaining in a low range for an extended period.
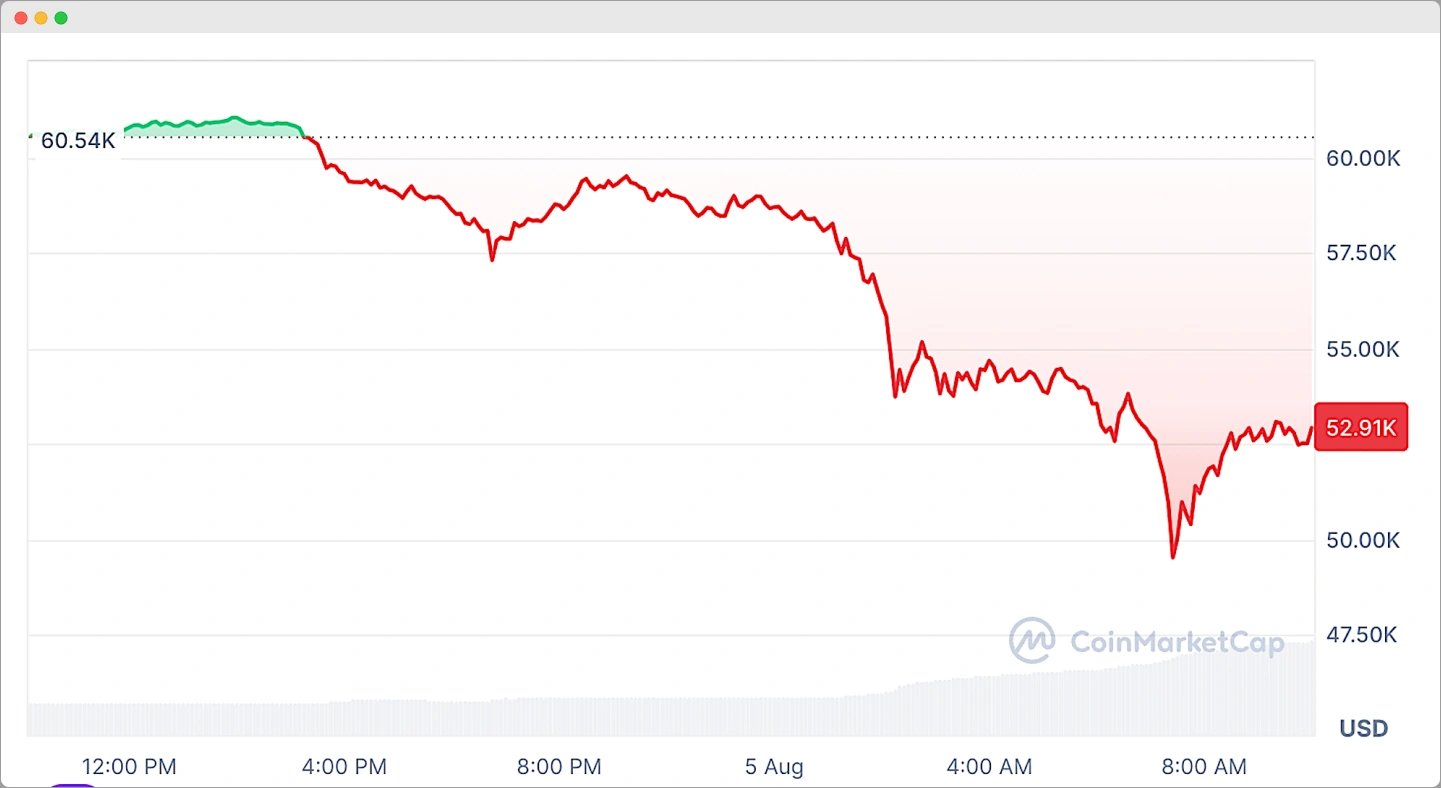
- March 2020 Market Crash: Amid the onset of the COVID-19 pandemic, the index dropped to extreme fear levels, correlating with a rapid price decline.
- As the market slowly recovered from the initial shock, the index began to climb again, reflecting a gradual return of investor confidence.
Reliability of the Crypto Fear and Greed Index
Despite its usefulness, the Crypto Fear and Greed Index comes with notable limitations.
The index is inherently reactive, it mirrors current market sentiment rather than predicting future movements.
Its reliance on a limited set of data points means that sudden, impactful news events may not be immediately reflected.
Moreover, the index’s primary focus on Bitcoin can result in a less accurate depiction of sentiment across the entire cryptocurrency market.
Data quality issues and biases in social media sentiment analysis may also affect the reliability of the index.
Thus, while it serves as a valuable gauge of market emotion, it should always be used as one component of a broader analytical framework.
Alternative Sentiment Indices and Metrics

Beyond the Crypto Fear and Greed Index, several other tools provide insights into market sentiment, each offering unique perspectives:
- On-Chain Metrics: These tools analyze blockchain data, such as transaction volume and active addresses, to deliver a fundamental view of network activity and investor behavior.
- They offer granular insights that can complement the broader sentiment captured by the index.
- Volume Profile Indicators: These indicators focus on trading volume at specific price levels, helping to identify areas of support and resistance.
- By revealing the price levels where significant trading activity occurs, they can offer actionable signals in conjunction with the sentiment score.
- Proprietary Sentiment Trackers: These trackers use artificial intelligence and machine learning to sift through social media, news, and other data sources.
- They provide a timely and nuanced perspective on market sentiment that can serve as a counterpoint to the general overview provided by the Fear and Greed Index.
Each of these alternative tools has its advantages and limitations.
For example, on-chain metrics deliver a fundamental analysis but may miss broader emotional trends, while volume profile indicators provide detailed trading insights but are largely backward-looking.
By combining these diverse approaches, investors can construct a more robust and comprehensive market analysis, mitigating the risks associated with relying on a single metric.
Conclusion
The Crypto Fear and Greed Index is a powerful tool that encapsulates the complex and often volatile emotions of the cryptocurrency market into a single, understandable number.
While the Crypto Fear and Greed Index ability to highlight extreme fear or greed can signal potential market opportunities or risks, its limitations necessitate its use as part of a broader analytical strategy.