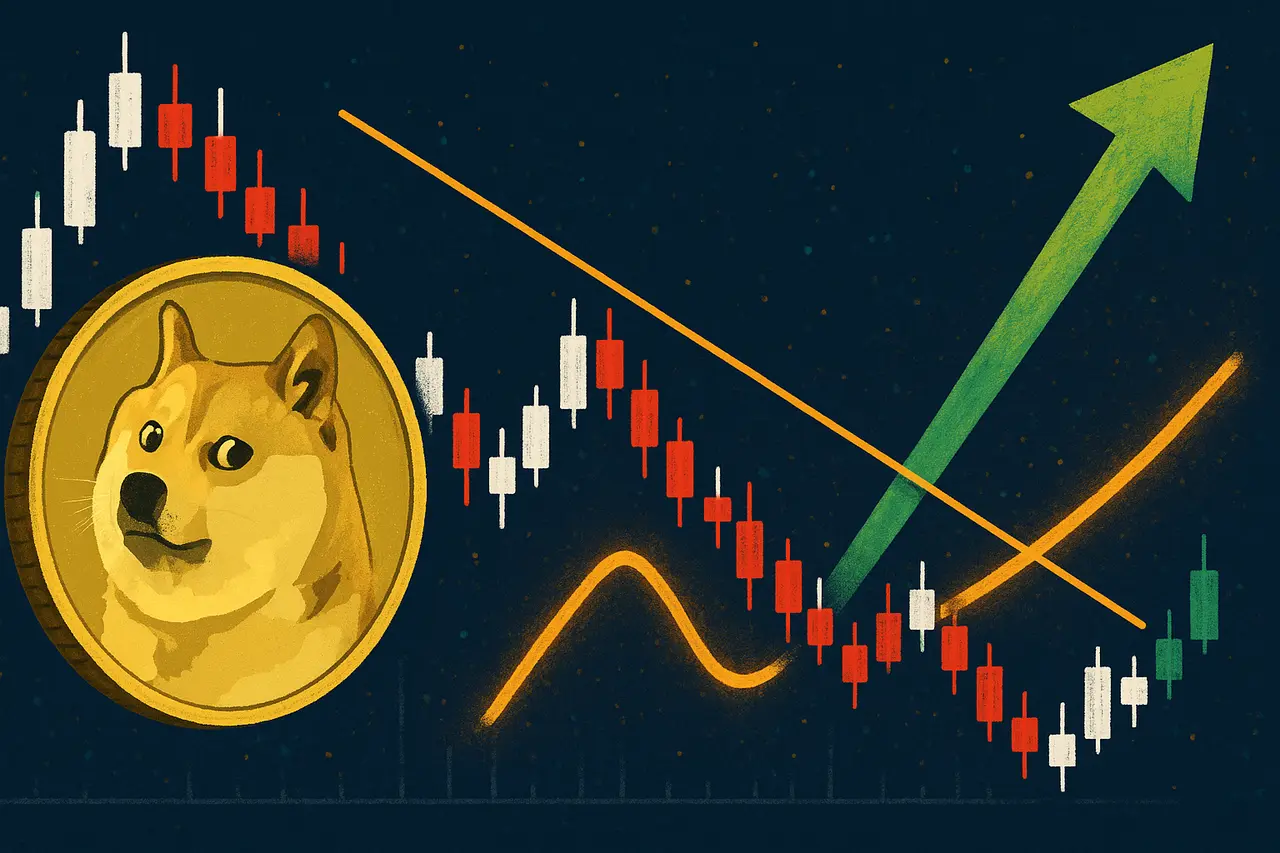
Dogecoin (DOGE) Struggles to Break Resistance: Will the Trend Change?
Dogecoin (DOGE) has been under significant selling pressure in recent days, with the price dropping more than 5% in a week and trading below $0.25.
Despite attempts to recover, technical indicators suggest that bearish pressure is still dominating the market.
Ichimoku Cloud Analysis: Bearish Structure Still Prevailing
According to information we have quoted from Beincrypto media, the Ichimoku Cloud chart shows that DOGE is below the cloud (Kumo), which is shaded red, indicating a strong bearish trend.
The Tenkan-sen line (blue) is below the Kijun-sen (red), reinforcing the short-term bearish view.
The price is also struggling to break above the Tenkan-sen, which acts as dynamic resistance.
However, the Kumo cloud in front is starting to change from red to green, indicating a potential change in sentiment if the price manages to break through the cloud.
However, this cloud is quite thick, indicating a strong resistance zone that requires significant bullish momentum to break through.
- Amazon and Walmart Enter the World of Stablecoins: New Innovations in Payment Systems
- This Week in Crypto: Global Tensions, Stablecoin Rules, and Coinbase Innovation
- Increasing Stablecoin Activity in TRON Ecosystem: The Big Role of Whales and USDT Expansion
- Global Turmoil: Bitcoin or Gold, Which is Safer?
- Bitcoin Gains, Altcoins Under Pressure: What’s Going On?
BBTrend Indicator: Early Signal of Potential Trend Reversal
The BBTrend (Bollinger Band Trend) indicator is showing an increase from its lows, which could be an early signal that selling pressure is starting to ease.
However, this indicator is still in the negative zone, so further confirmation is needed to ensure a significant trend reversal.
Critical Levels: Resistance and Support
- Key Resistance: US$0.206
- Key Support: US$0.168
DOGE needs to break through the resistance level at US$0.206 to change the trend to bullish. If it fails, the price risks falling back to the support level around it.
Conclusion
Dogecoin is currently in a consolidation phase with bearish pressure still dominating.
Although there are some early signals of a potential trend reversal, further confirmation is needed to confirm a change in market direction.
Traders and investors are advised to monitor key resistance and support levels as well as other technical indicators to make informed decisions.


